
The ASX 200 extended its decline on Wednesday but price action is hinting at fatigue in the selloff. CBA slid to a fresh seven-month low, yet resilience from Materials — led by Fortescue — helped steady the broader index. With volatility narrowing and breadth improving, the market may be near a short-term inflection point even if the bigger trend remains under pressure.
View related analysis:
- Australian Dollar Jumps, ASX Falls as Strong Jobs Data Fuels RBA Hike Bets
- ASX 200 Evening Wrap: Tech and Banks Extend Losses, WOW Perks Up
- ASX 200 Evening Wrap: CBA Drags Index Lower as Financials Buckle
- Nasdaq 100 Lags Dow Jones: Divergent Signals Among Nvidia, Apple, Meta
ASX 200 Market Wrap: CBA Slumps, FMG Shows Strength
ASX 200 Market Snapshot
- The Australian share market closed at a fresh five-month low on Wednesday, although bearish momentum is waning with its smallest daily range in two months at 0.48%.
- Seven of the 11 ASX 200 sectors declined, led by Financials (XFJ), Utilities (XUJ) and Information Technology (XIJ).
- Energy (XEJ), Materials (XMJ) and Real Estate (XRE) led the four ASX sectors higher.
- Bearish breadth also eased, with just 101 stocks declining (50.5%), down from 171 yesterday.
- The big four banks were all lower as Financials continued to fall, led by ANZ (-2%).
- Commonwealth Bank (CBA) — the biggest stock in the ASX — fell 1.2% to a fresh seven-month low.
- Macquarie Group (MQG) fell 1.4% to a six-month low.
- Goodman Group (GMG) was the worst performer among the ASX 20 mega-caps, falling 3.8% to a three-week low.
- Fortescue Metals (FMG) was the second-best performer among the ASX 20, closing back above $20 as the Materials sector weathered the broader market selloff.
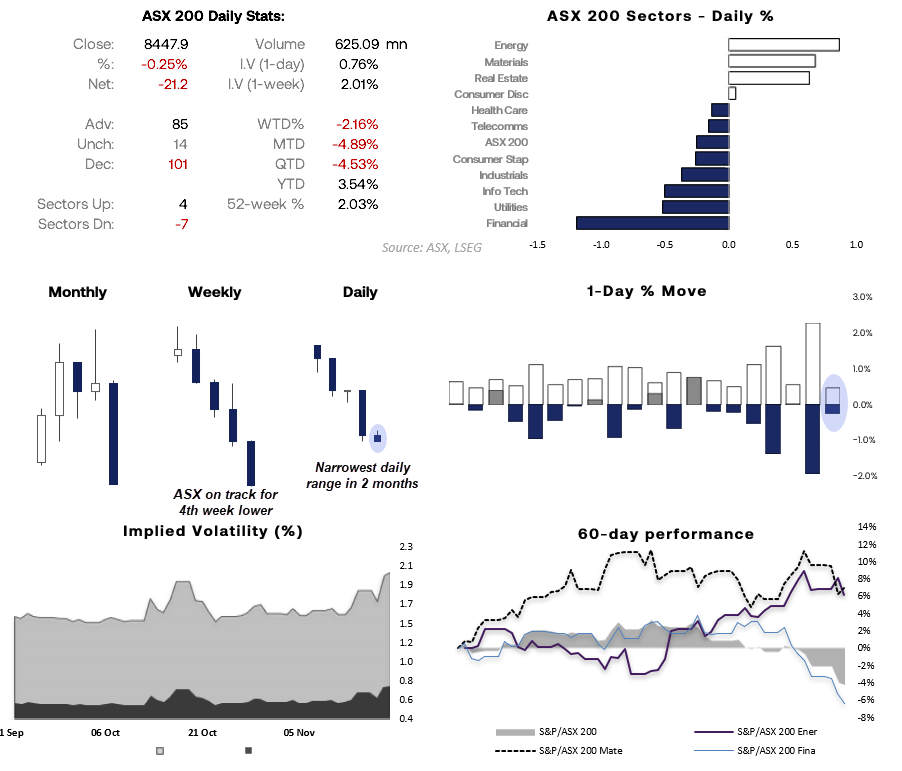
Chart analysis by Matt Simpson - source: ASX, LSEG

Commonwealth Bank (CBA) Technical Outlook
CBA investors aren’t having the best time, with the ASX’s number-one mega-cap stock falling to a fresh seven-month low on Wednesday. However, the move may be due for at least a pause — if not a short-term bounce.
It has fallen just shy of -20% from its all-time high, a threshold that marks a technical bear market once crossed. Markets also tend to stabilise or even reverse when these milestones are approached, possibly in spite of the inevitable headlines that accompany them. We also saw CBA pause just above the April VPOC on Tuesday and only trade marginally below it today.
More importantly, today’s low held above the 20-month EMA (150.30), the 150 handle, and the monthly S3 pivot. With the daily RSI(2) heavily oversold at 2.7, I suspect this leg lower is nearing exhaustion — and that could also line up with a minor bounce for the broader ASX.
Even so, I still expect both CBA and the wider market to face further downside in due course.
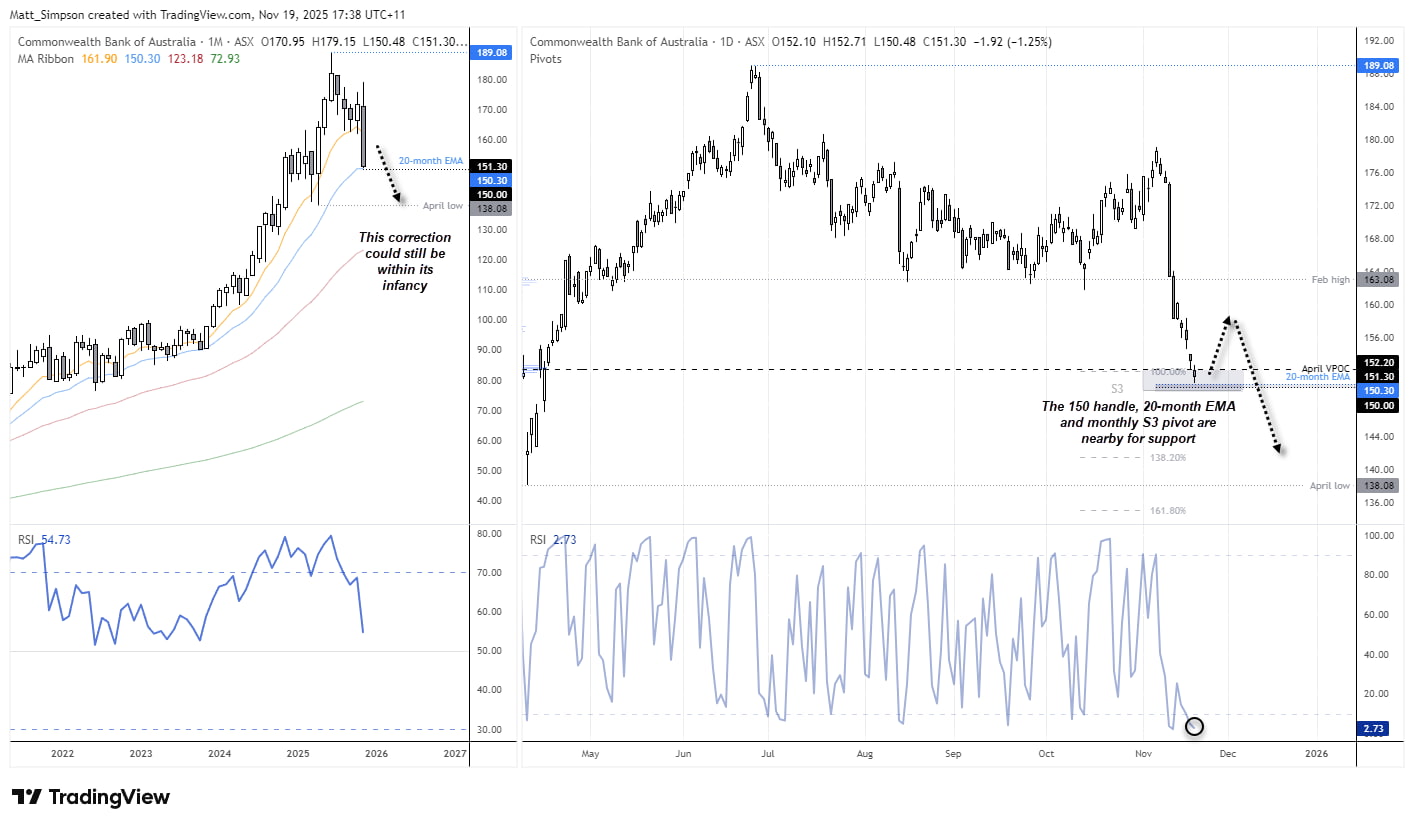
Chart analysis by Matt Simpson - source: ASX, TradingView

Fortescue (FMG) Technical Outlook
FMG has made its way back onto my bullish watchlist as it continues to hold its ground despite selling pressure elsewhere across the ASX. Fortescue reached my bullish triangle in late October and even pushed higher before pulling back towards its 50-day EMA, where it has since been contained within a sideways range.
I can’t say with confidence that FMG’s correction is over, but the fact it has held around $20 despite aggressive selling across most ASX stocks is impressive. If the ASX starts to stabilise or attempts a rebound, that could support further upside for FMG over the near term.
Prices are trading just beneath the monthly pivot point (20.50). A break above this level could see bulls target 21 again, or even its recent high around 21.50. Low-volatility retracements towards the original triangle breakout level (19.59) or the monthly S1 pivot (19.46) may attract dip-buyers and improve the reward-to-risk profile.
Any signs of aggressive bearish candles on the daily chart would invalidate the near-term bullish bias.
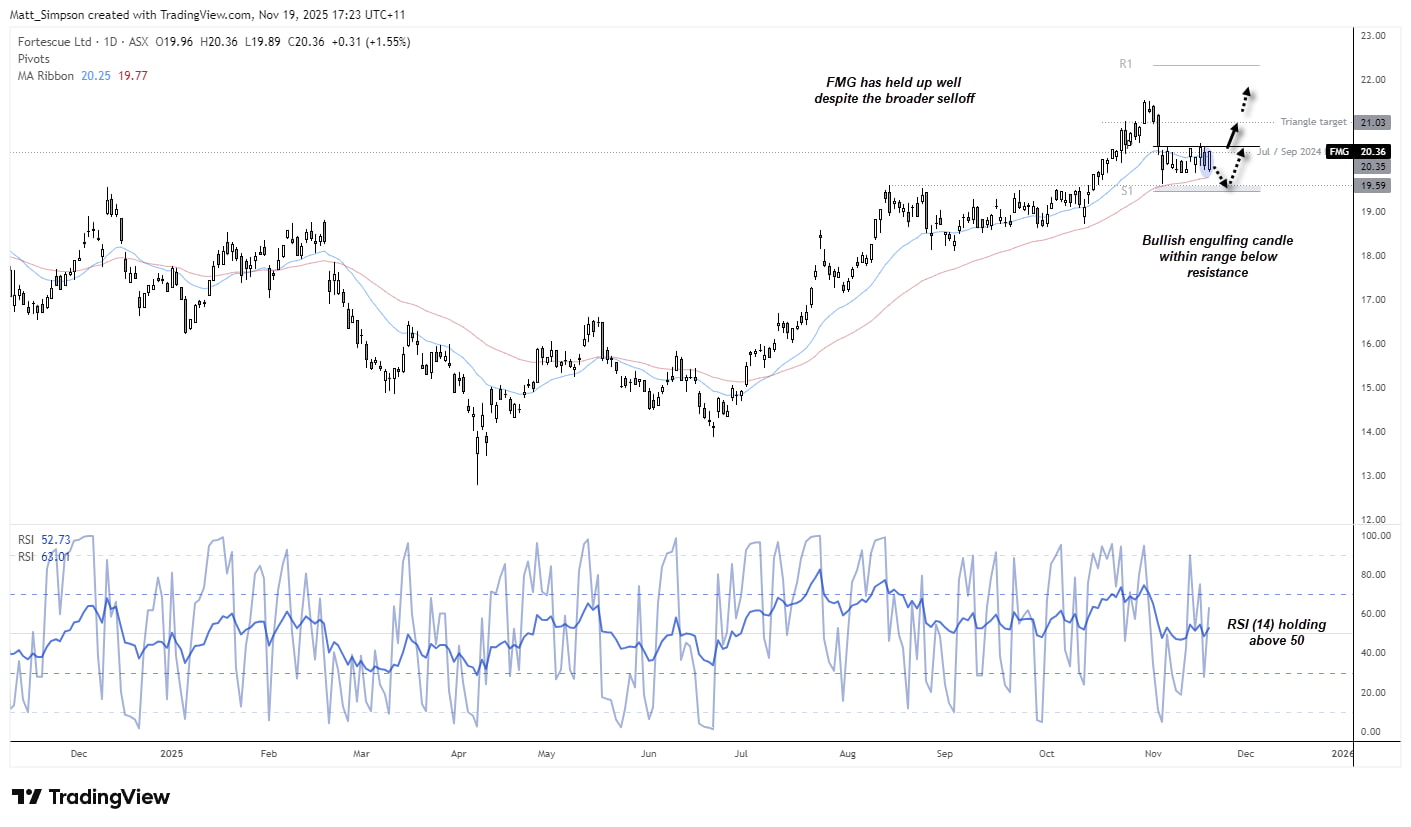
Chart analysis by Matt Simpson - source: ASX, TradingView
View the full economic calendar
-- Written by Matt Simpson
Follow Matt on Twitter @cLeverEdge
How to trade with City Index
You can trade with City Index by following these four easy steps:
- Open an account, or log in if you’re already a customer
• Open an account in the UK
• Open an account in Australia
• Open an account in Singapore
- Search for the market you want to trade in our award-winning platform
- Choose your position and size, and your stop and limit levels
- Place the trade